Machine-health monitoring · New Jersey & Eastern PA
Machines change before they fail.
McCartney Diagnostics monitors the sound and vibration signatures of your pumps, compressors, motors, and fans, and flags the drift that comes before a breakdown. You fix it on your schedule instead of during a line-down emergency.
How it works
The same way your most experienced operator knows a machine is "running rough", except measured, around the clock, and never on vacation.
Start with the data you have
Sound, vibration, or existing sensor logs from machines running normally. If you have records of past failures, those are used too. Collection fits around your operation: no controls touched, no downtime.
The model learns your machine
Every machine has its own signature, and the model learns yours rather than a generic factory average. Labeled failure history sharpens it, but it does not require any: it can learn from healthy operation alone.
Drift becomes an early warning
New readings are scored against that baseline. When the signature starts to drift from bearing wear, cavitation, or imbalance, the score rises long before the failure does.
Tested before it's sold
Validated on the MIMII industrial-sound benchmark: real factory pump recordings with confirmed faults, scored blind on machines the model never heard during training.
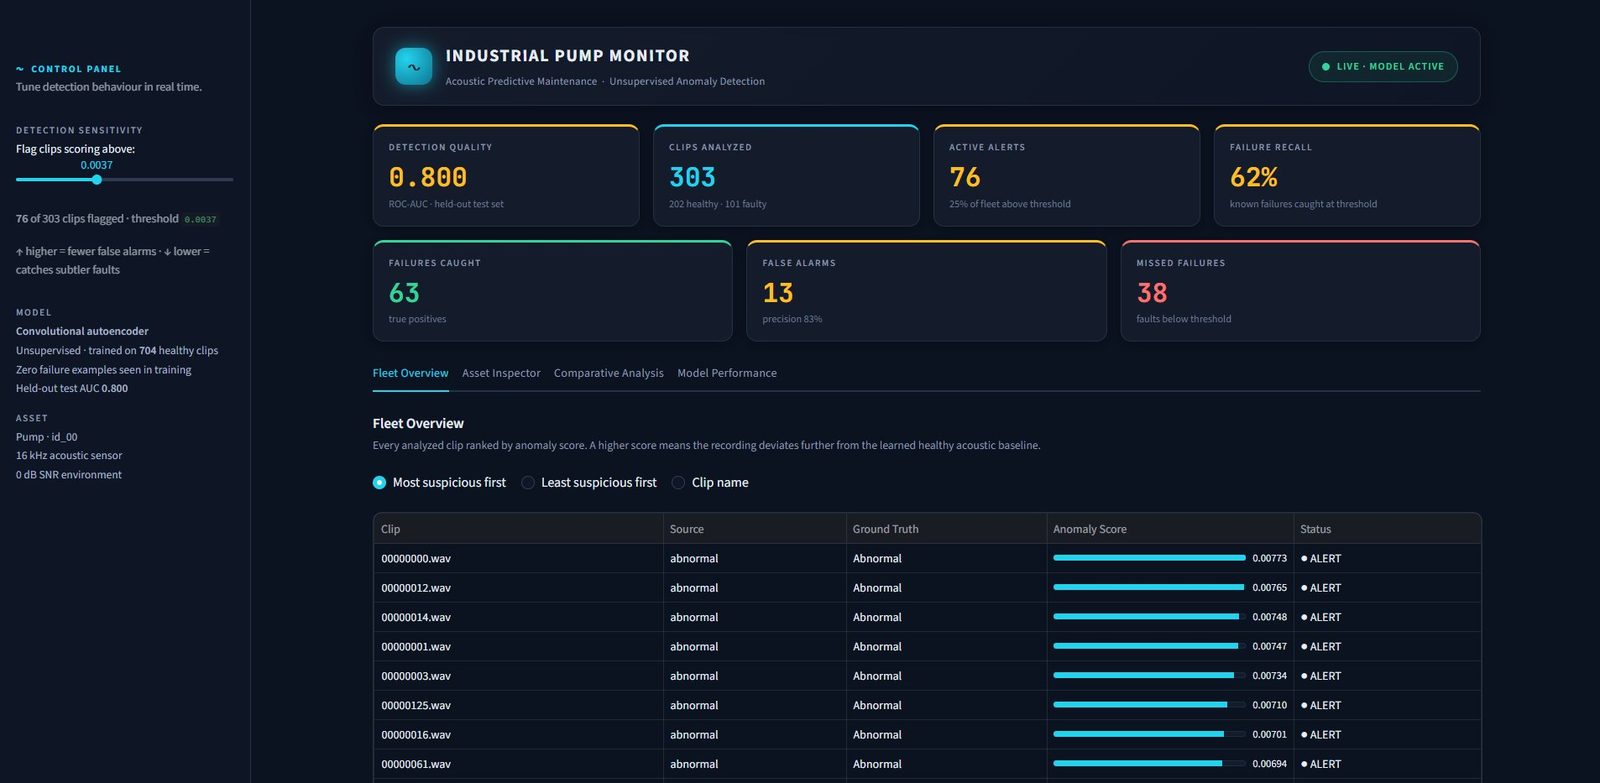
FIG. 1 / MONITORING CONSOLE · 303 HELD-OUT RECORDINGS RANKED BY DEVIATION FROM HEALTHY BASELINE
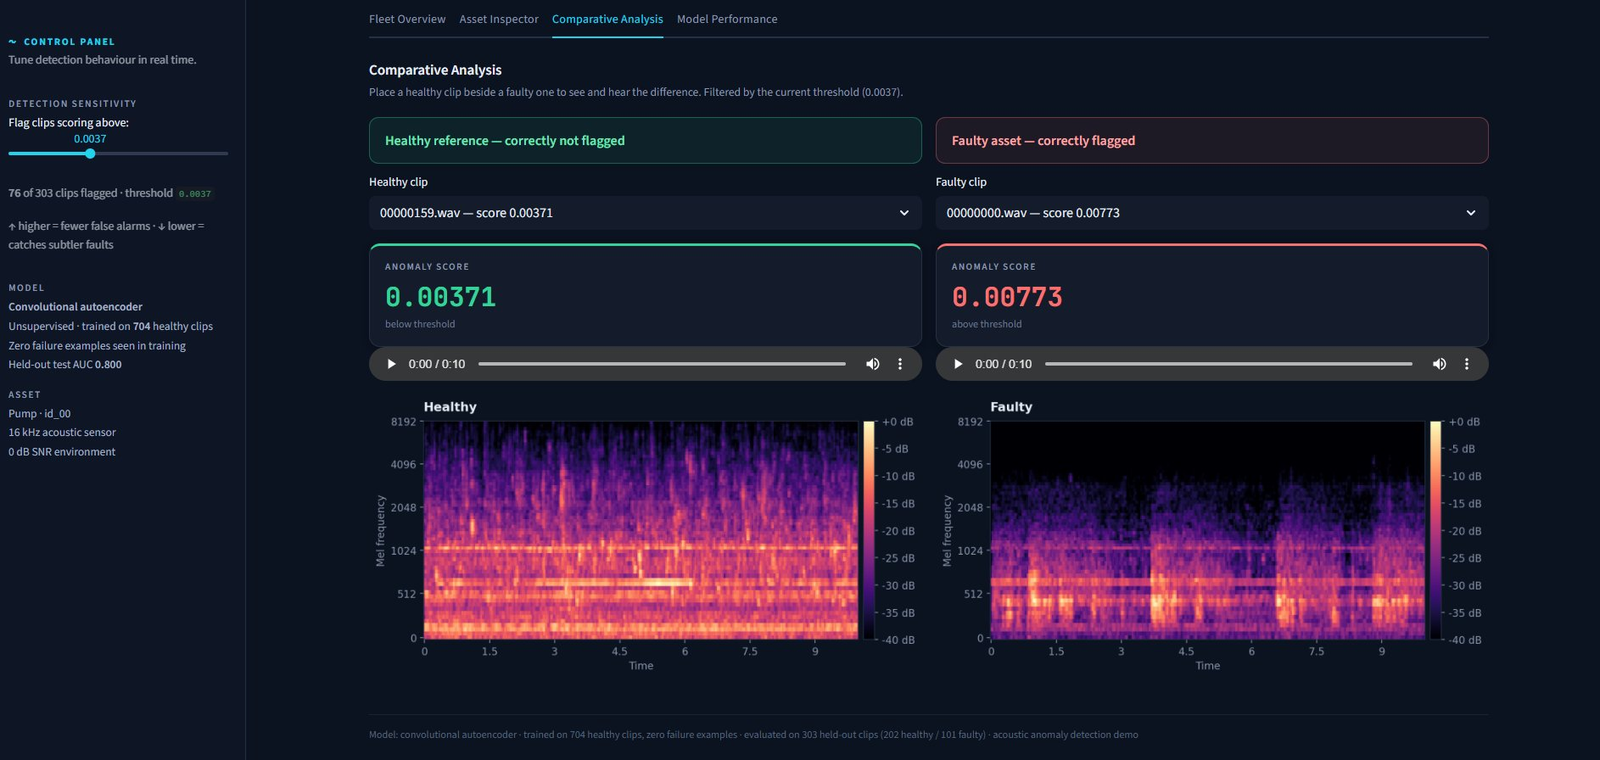
FIG. 2 / SIDE-BY-SIDE: A HEALTHY PUMP AND A FAULTY ONE. THE FAULT IS VISIBLE IN THE SPECTROGRAM, AUDIBLE IN THE RECORDING, AND SCORED 2× HIGHER BY THE MODEL.
Tell me about the machine you trust least.
I'll come out, walk the floor with you, and learn how your equipment fails: which machines cause the headaches, how your operators catch problems today, and what kind of early warning would actually be useful to your team. You'll get straight recommendations on sound and vibration monitoring, what to measure, and where it makes sense, whether or not you ever work with me. Half an hour, no slides.
No contract · no obligation · just a conversation about your equipment